1 User Guide
1.1 Overview
Hiplot is a comprehensive, open, and advanced one-stop platform for biomedical visualization and analysis, which includes four main modules: Cloud Tools, Cloud Workflow, Cloud Study, and Cloud Market. The Cloud Tools module contains a near-exhaustive collection of scientific research plotting and data analysis tools. The Cloud Workflow module enables customized omics data full-process automatic analysis. The Cloud Study module covers a complete series of tutorials on life science data analysis, from beginner to expert levels. At Hiplot, you can also learn the latest bioinformatics analysis techniques, discover the hottest scientific research news, publish your custom service requests on the Cloud Market, or share your excellent code with the world. Hiplot - focused on research, serving health.
1.2 Cloud Tools
1.2.1 Tool List
Upon entering the website’s Cloud Tools module, you will first see the Cloud Tools list as shown below. The following sections will provide a detailed description of each part’s purpose.
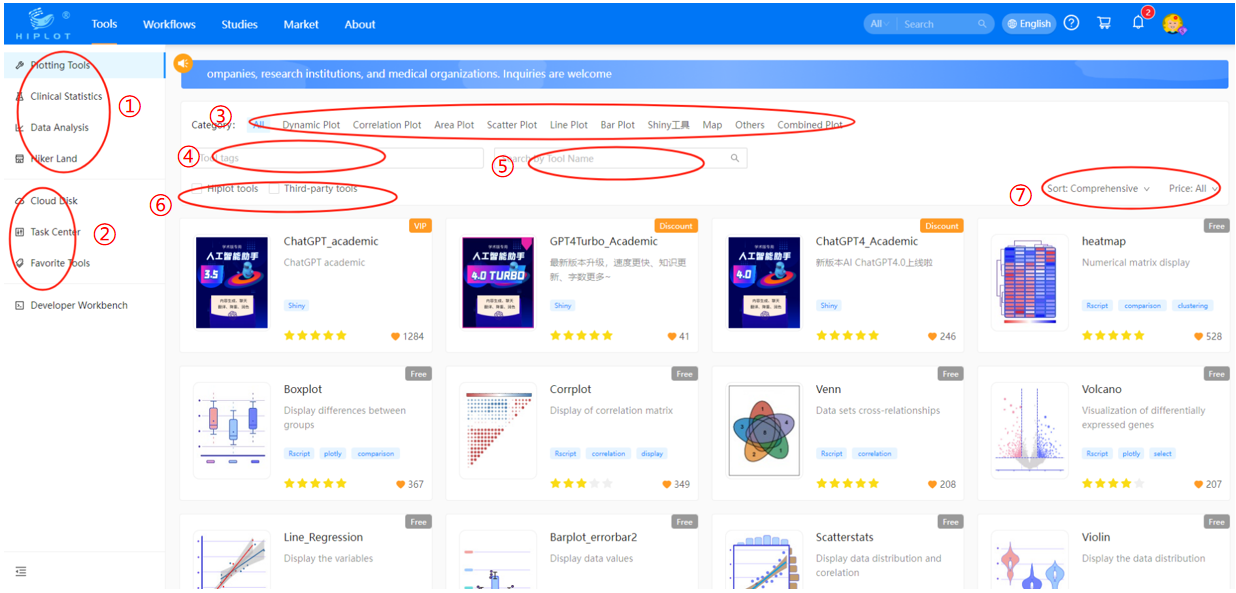
Figure1.1: Cloud Tools List Page
The Cloud Tools List page mainly consists of the following parts, with specific functionalities as follows:
①:Switch between Cloud Tools categories.
②:Cloud Tool-related supporting functions, including My Cloud Drive, Task Center, My Favorites. Specific methods of use will be described in detail later.
③:Filter tools by functionality categories.
④:Filter tools by tool tags, with multiple selections possible.
⑤:Filter tools by text search.
⑥:Option to display only Hiplot-managed tools or third-party tools.
⑦:Choose the tool list sorting method or filter tools by price.
1.2.2 Tool Usage
After selecting the desired tool, click on the tool’s name to enter the tool details page, as shown below. Tools are mainly divided into two types: regular tools and shiny tools. Here, we’ll first use the heatmap tool as an example to detail the method of using a standard Cloud Tool.
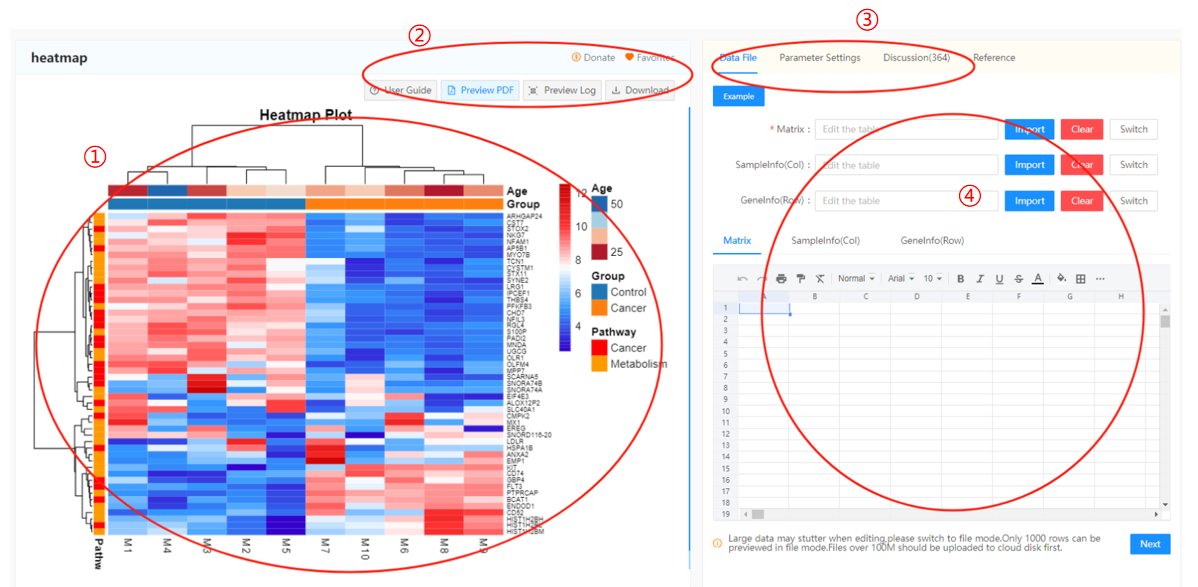
Figure1.2: Cloud Tool Detail Page
The Cloud Tool Detail page mainly consists of the following parts, with specific functions as follows:
①:Cloud Tool output result preview window. Before using a tool, an example result will be shown here, and after the tool has run successfully, the run result or failure log will appear. This part can include a variety of content formats such as PDFs, images, tables, logs, dynamic web pages, etc.
②:Cloud Tool functionality area. The upper two buttons allow you to reward the tool developer or to add the tool to your favorites. The four buttons below, from left to right, are: View User Guide, View Output Results, View Tool Log, and Result Download button; the latter may include various formats of results, such as table files or Rdata files, which are not displayed on the interface. After tool execution, you can check the download button to view the result list regularly.
③:Buttons to switch between functionalities on the right side of the Cloud Tool. Among these, the data file page is for selecting the input data for the tool; the parameter settings page is for setting the tool’s running parameters; the discussion page is for posting comments.
④:Cloud Tool functionality area on the right. The image shown is the data file page. The sample file button in the upper-left corner can be used to load example data for testing, and the sample file can also be downloaded locally for inspection. Each tool may require 1-3 different input data files, which can be uploaded from the local machine or selected from the Cloud Drive. Files uploaded directly from the local machine are deleted after computation, while input files in the Cloud Drive are retained indefinitely. The data preview at the bottom allows viewing of the content for input table files, but other non-table forms of input cannot be previewed.
After setting the input data files, click “Next Step” to enter the parameter settings page. This page may contain 1-3 different parameter fold-down menus. We usually categorize parameters by function and place them in the same fold-down menu, making it more intuitive and convenient for users. After all parameters are set, you can click the submit button at the bottom to submit the drawing computation, waiting for it to complete. If the result is not satisfactory, you can directly adjust the parameters without re-importing the data. Additionally, the other three buttons below have the following functions: Reset, which resets parameters to their default state; Export Parameter File, which records the current settings and saves them as a file for future importing; Import Parameter File, which imports previously exported parameter files to restore parameter settings.
Shiny tools are a different category of tools, and their usage differs from regular tools. Shiny tools do not involve input files and parameter settings; all their functionalities are self-contained in the window on the left side. If the window is too small to display all functionalties, a fullscreen button is available to display the tool in full screen. The right sidebar for shiny tools only contains the usage guide and discussion area and does not involve the use of tool functionalities. However, it’s important to note that shiny tools may take longer to load upon opening, so please be patient.
1.2.3 Other Functions
My Cloud Drive
Your Cloud Drive is primarily used to store input data and computational results from Cloud Tools. It supports functions like file upload, download, delete, copy, move, and create new folders. All non-example data computation results of Cloud Tools are saved in the tasks folder under the task ID folder in the Cloud Drive for download and inspection. Please note that the Cloud Drive space is limited, so you may need to clean up files when reaching the storage limit to continue executing tasks. Additionally, you can save your data files in the Cloud Drive space for quick access in all Cloud Tools.
Task Center
The Task Center saves the history of all non-example Cloud Tool tasks you have executed. Here, you can view the tool execution history, rate tools, or delete task records. The viewing functionality allows you to see the tool’s execution history, download result files, and, for tasks that used data files from the Cloud Drive as input, support modifying parameters for re-running the tool.
1.3 Cloud Workflow
1.3.1 Overview
Utilizing Hiplot’s proprietary omics analysis framework and leveraging WDL and Docker technologies, we have established a novel computational platform for omics analysis, built atop high-performance computing clusters. This platform offers users an efficient and convenient experience. It adheres to the open standards set by the GA4GH community, incorporating a wealth of workflow tools and public datasets for modular and versioned workflow management. There are six major analytic sections built-in: genomics, transcriptomics, proteomics, metabolomics, microbiomics, and epigenomics, distilling years of hands-on analytic experience from our team. Keeping up to date with the latest global software algorithm resources and integrating them with our proprietary framework, Hiplot offers personalized customizations that create standardized, highly reliable, and versatile analysis reports. With trustworthy analysis workflows come authoritative, precise, and valuable results. Hiplot — interpreting life with numbers, empowering precision medicine with big data.
1.3.2 Workflow List
The Hiplot cloud workflows are categorized into six main types: transcriptome (RNA), genome (DNA), proteome, metabolome, microbiome, and epigenome. Additionally, for ease of search, common tools are aggregated into one category. Select the required tool and click to enter the platform to access the detailed page. On the details page, you can view the product introduction, application fields, cases, version records, and pricing standards. Common pricing standards are based on a basic fee plus data volume charges. Before use, you can click on the DEMO tutorial button in the center to add a DEMO task to your task center for inspection. DEMO tasks do not have all the functions of regular tasks; they cannot perform drawing modifications or apply changes to the report and are only for viewing report formats and workflow listings. After inspecting the DEMO task, click Start Analysis to begin submitting data and analyzing it through the cloud workflow.
1.3.3 Starting Analysis
Click Start Analysis to begin submitting a cloud workflow task. The submission process is divided into four steps: Project Information - Data Import - Analysis Workflow - Begin Execution.
Project Information
Fill in the relevant project details, including: Project name: Enter according to the project content Description: Enter according to the project content Species: Select species Experimental Platform: Select experimental platform Experimental type: Choose “Other”
Data Import
The data import page has two tabs: Sample Data and Sample Information, which can be switched by clicking on the top left corner of the page. In the Sample Data tab, the box on the left contains project files, and the one on the right contains all your uploaded files (for uploading methods, refer to the file upload method section). Select the necessary files on the right and click the left arrow button between the two boxes to add files to the project. After adding the project files, go to the Sample Information tab to fill in the sample information.
This tab consists of a sample information table, where each row corresponds to the sample data files you added; the first column is for file names, and the second column is for sample names, while the other columns are for grouping. You can modify the number of groups by adding/deleting group buttons, with a minimum of one and up to five groups supported. Sample names and groups can be filled in at will according to the actual situation. It is recommended to use English names here. Moreover, you can download the table template file on the top right corner, complete it locally in EXCEL or similar software, and then upload it to automatically fill in sample information.
Analysis Workflow
Here you set the parameters specific to the workflow, which may affect its operation. Please refer to the instructions on the right side of the page for settings.
Begin Execution
The left side of this page shows the flowchart, and the right side displays the task billing interface. If it’s a free tool, you can directly click Start Analysis to submit the analysis. Otherwise, first click to pay to complete the payment, and then click Start Analysis.
After submitting your task, you can view the real-time progress in the task center; click the drop-down arrow on the far right of the task list to reveal the steps’ running process and status, and to download intermediate results.
If a task fails, you can click the pencil button to edit the parameters and resubmit. However, you cannot modify the sample data files (due to billing issues). If you encounter problems, contact customer service for assistance.
Once the process task is fully completed, you can view the results and download the report. If you wish to adjust the results in the report, refer to the next section to view and modify the results.
1.3.4 Viewing and Modifying Results
After the cloud workflow task runs successfully, you can click the View button in the task list to enter the results viewing page. The result viewing page includes the following parts: 1) The final report page; 2) Project overview page; 3) Analysis guide page; 4) Group information page; 5) Result modification page.
The first three pages are fixed and unchanged, while the group information page allows you to modify the sample grouping and batch execute analysis tasks, which will be detailed in the following section. The result modification page may contain several subtasks under multiple major categories, as determined by the workflow tools themselves. If you need to modify a plot in the report, you can find the corresponding section on this page, adjust the parameters, and submit until you are satisfied with the result. At that point, clicking on Store in Report will save the current plot into the final report. Before clicking Store in Report, there will be no changes to the report.
1.3.5 Modifying Sample Group Information
The Group Information page allows you to modify sample groups, delete certain samples, and batch execute subsequent analysis tasks. The Sample Information page is divided into three parts:
Sample Information: It’s possible to modify sample names, group information, and add or remove samples. You can edit the group content by adding or removing groups via downloading and uploading the template. On the far right, you can use the checkboxes to add or remove samples. Note: It is not recommended to change the sample names here.
Parameter Settings: Set the parameters for this batch execution task.
Analysis Contents: Set the tasks that need to be executed. Note that some subtasks must be performed or cannot be executed again. The content set in the sample information and parameter settings will only take effect if selected here and re-executed. Here, the task ID starting with BATCH distinguishes it from single modifications starting with EDIT, which you can switch to view in each subtask detail.
After all settings are complete, click the Submit button to modify the group information and batch execute tasks.
1.3.6 File Upload Method
For smaller files, direct web upload is possible. For larger files, Hiplot offers FTP for uploading, as follows.
First, download the corresponding client version from the interface shown below and click the Get Username and Password button. Here, the Filezilla client is provided, but other FTP software may also be used.
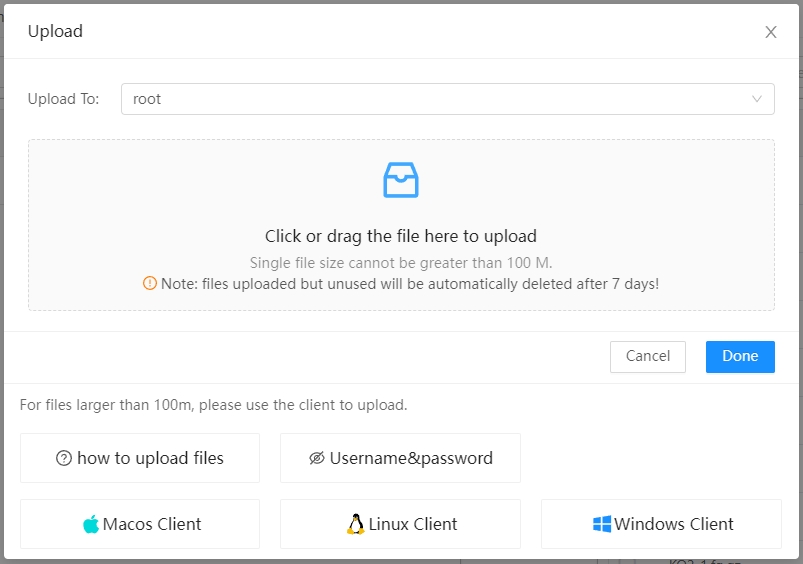
Figure1.3: FTP Upload Method
After clicking the Get Username and Password button, you will receive your username and password—keep them secure.
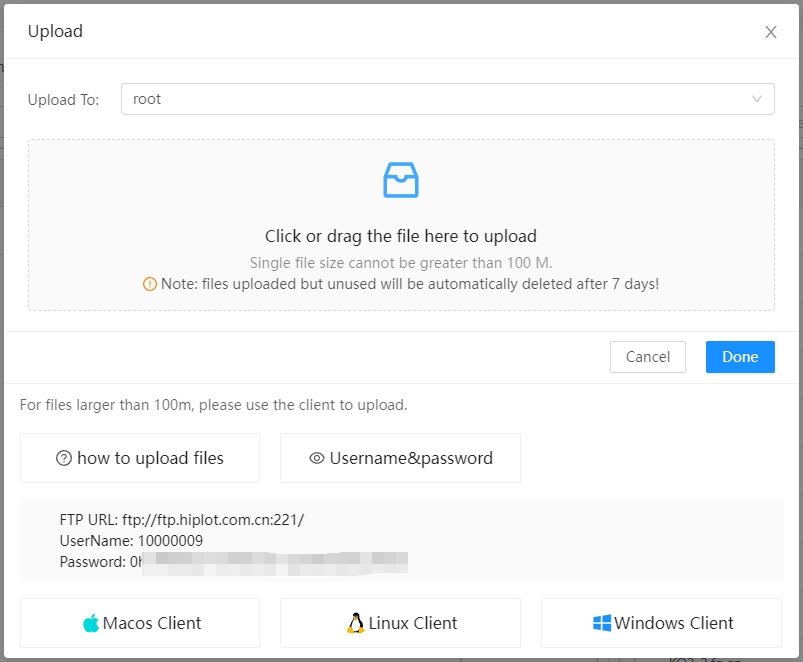
Figure1.4: FTP Account
Open the FTP client and enter the address, username, and password as follows, then click Quick Connect.

Figure1.5: FTP Login
The first time you connect, you may receive a prompt like the one below; confirm to proceed. Then, you are ready to start uploading files. Please note that the FTP file service provided by Hiplot can only be used for cloud workflow tasks. Once files are uploaded, they cannot be downloaded, deleted, or renamed, and files not used for a long time may be cleared.
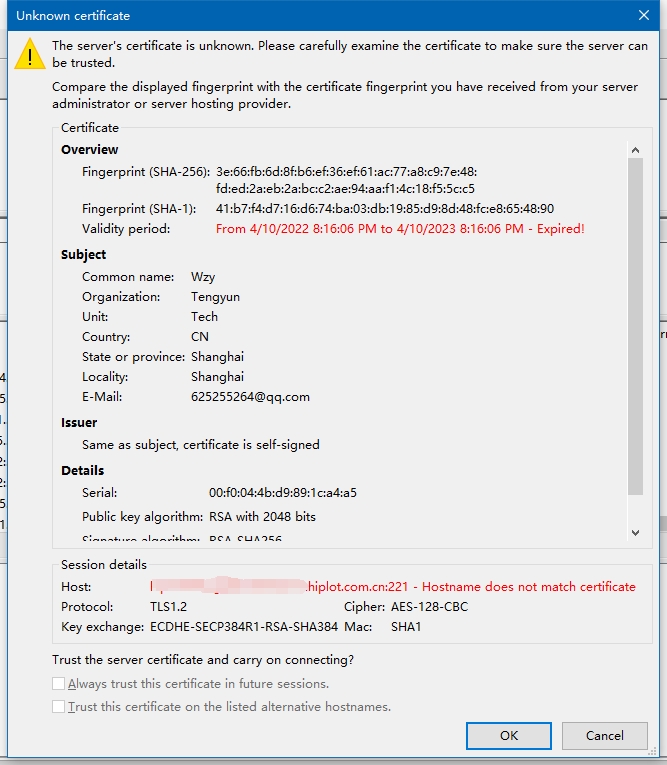
Figure1.6: FTP Confirmation
1.4 Cloud Marketplace
The Cloud Marketplace consists of two parts: the Service Mall and the Demand Market. The Service Mall mainly sells products related to the Hiplot website and other services. For detailed information and usage methods, please refer to the product content description.
The Demand Market provides an open platform for information exchange, where you can post your requirements to solve specific problems, or accept commissions from others. If you have any suggestions for improvement of the self-operated tools on the website, you can also put forward your ideas here, and it’s completely fine even without offering a reward.
1.5 Other Features
1.5.1 Feedback
There is a feedback button located at the central right side of the website. Should you have valuable suggestions, please submit them to the website. If adopted, you will be rewarded with Hi coins.
1.5.2 Earning Hi Coins
Hi coins are a unique virtual currency on the Hiplot platform. Users can obtain Hi coins through registration, point rewards, and other means, which can be used for deductions and discounts when purchasing services. Note that Hi coins are not equivalent to real currency, cannot be purchased with cash, and not for sale within the platform; they serve only as a measure of user activity and as an assessment of developer levels. In addition, a certain amount of Hi coins will be deducted as one of the means to address violations when a user breaks the platform’s rules. For the specific management system of violations, please refer to “Platform Violation and Handling System”.
Users can obtain Hi coins through various methods, with VIP and SVIP members having double privileges in certain acquisition rules. For specific rules and VIP/SVIP Hi coin multipliers, refer to the table below:
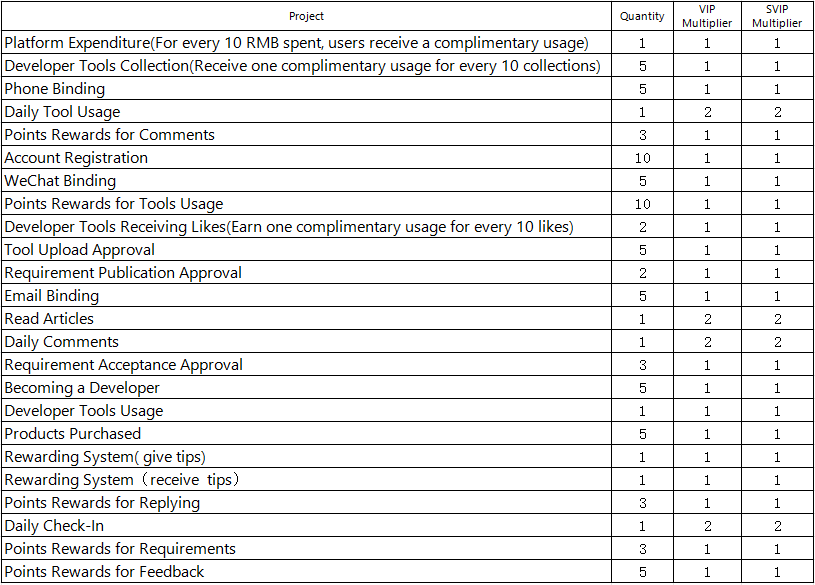
Figure1.7: Hi Coin Acquisition Rules
There are mainly two usage scenarios for Hi coins: 1. In the Cloud Marketplace, Cloud Tools, Cloud Processes, purchasing memberships, and most other consumption scenarios, Hi coins can be used for deductions at a ratio of every 10 Hi coins for 1 Chinese Yuan. 2. The primary ways of obtaining Hi coins can indicate the user’s level of activity, especially for developers, in terms of tool usage frequency and user feedback. Hence, the number of Hi coins is an important metric for assessing developer levels, where each Hi coin adds 1 experience point to the developer. For the method of calculating developer experience values and promotion rules, please see “Developer Experience and Level Regulations”.
Disclaimer
Hiplot platform is exempt from any legal liability in the following situations:
1.Disputes arising from the use of third-party payment channels during the recharge process by the user;
2.Losses caused to the user due to sharing a password with others;
3.Losses caused by the user’s intentional misconduct or gross negligence, or by third parties outside of this agreement;
4.Various situations and disputes caused by force majeure and unforeseeable circumstances including but not limited to: hacker attacks, government control, and virus invasion.